Image
Opinion | Iko Knyphausen | June 18th, 2026
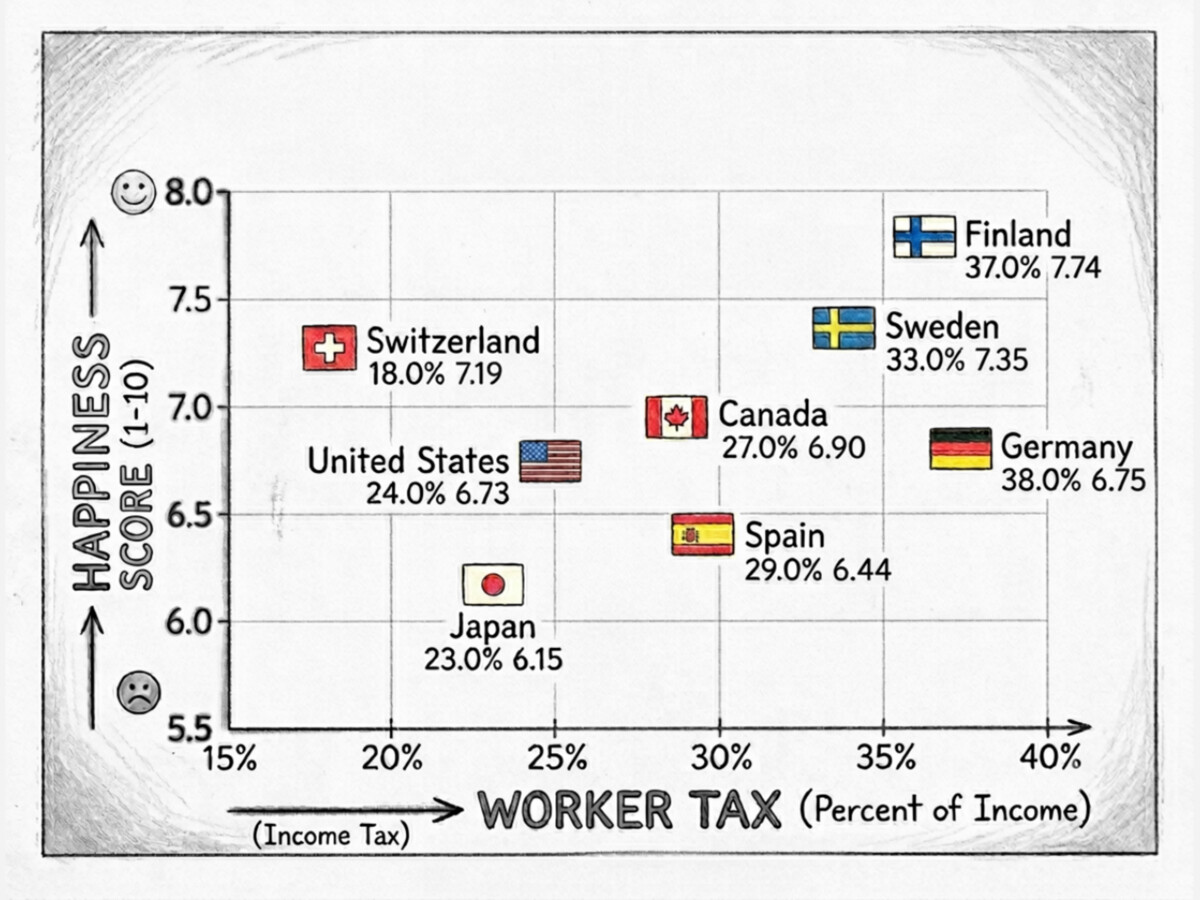
Every March, the United Nations publishes the World Happiness Report: a ranking of 147 countries by how their citizens rate their own lives on a scale of zero to ten. In 2025, the United States placed 24th.1 Finland placed first, for the eighth consecutive year. Sweden ranked fourth. Switzerland thirteenth. Canada eighteenth. Germany twenty-second. These are peer nations, all wealthy, all democratic, all facing the same pressures from globalization, aging populations, and technological disruption. The United States is being outperformed by countries that look a great deal like it, and the gap is growing. Among Americans under thirty, the happiness ranking falls to 62nd. For Americans over sixty, it is 10th. The overall figure is already a verdict. The youth figure is a warning about the future.
Every developed society requires a certain level of social investment to produce good outcomes in health, education, security, and retirement. That investment can be made collectively through taxes, or individually through private expenditure, or some combination thereof. The United States has chosen a lower tax base than all seven peer countries in this comparison, leaving a gap between what public funding covers and what individuals actually need. Americans fill that gap with private funds: insurance premiums, out-of-pocket medical costs, childcare fees, tuition, and retirement account contributions.
The gap carries a price. Private markets for social goods cost more than pooled systems by design: they cannot spread risk across the entire population, they require profit margins, and their costs fall disproportionately on those least able to bear them. The argument here is straightforward: the return on collective social investment, measured in health, education, security, and happiness, runs substantially higher than the return on its fragmented private equivalent. The United States' total tax wedge on labor (income tax plus all social security contributions) runs at approximately 28 percent, compared with Germany’s 48 percent, Finland’s 42 percent, and Sweden’s 41 percent. The US is a lower-tax country. But the tax-to-GDP ratio of 27 percent captures only what flows to the government. It omits the enormous parallel system of private social costs that Americans pay to supplement what taxes do not cover. The average employer-sponsored family health insurance premium reached $25,000 in 2024.3 Full-time daycare costs an average of $16,500 per year nationally, the highest childcare burden as a share of income of any OECD country.3 A public university degree costs an average of $38,000 per year in total attendance costs. These are the private substitutes for what peer countries fund through taxes, and they are mandatory in every practical sense.
What the top-ranked countries share is sufficient total revenue to fund universal healthcare, free or near-free education, subsidized childcare, and retirement security, assembled through whatever combination of taxes their political systems settled on.
A Finnish family paying 42 percent of labor income in taxes receives universal healthcare at no point-of-use cost, free university education, and heavily subsidized childcare. An American family paying 29 percent in taxes and another 15 to 20 percent of income in private healthcare, childcare, and education faces a comparable or higher total social burden, and gets worse outcomes on every measure in return. The private supplement costs more, covers less, and distributes the burden regressively. The Finns are paying more in taxes. The Americans are paying more overall. The United States spends $15,000 per capita on healthcare, more than any other country in the world by a wide margin.2 Japan covers its entire population for $6,000 per capita, less than the OECD average, with the longest life expectancy in the peer group.2 American life expectancy is 79 years, the third-lowest in the OECD. Spain, at 84 years, spends less than a third of what the US spends and lives five years longer. This looks like a spending problem, and in one sense it is. But the overspending is a direct consequence of the pooling failure. Without national purchasing power, the United States has no leverage to cap pharmaceutical prices, which run roughly 2.8 times the average of peer nations. Without a unified billing system, administrative overhead consumes 34 percent of hospital expenditure, against 12 percent in single-payer systems. The US obesity rate of 43 percent, compared with an OECD average of 26 percent, reflects the downstream costs of a system that rations preventive care by income. America spends more because it pools less.
On the PISA mathematics assessment, which tests 15-year-olds across 81 countries, the United States scored 465 in 2022, the lowest among the seven peer countries and below the OECD average.4 Japan scored 533, Switzerland 508, Canada 497. The United States spends more per student than almost any peer country. The outcomes do not follow, and this case differs from healthcare. K-12 education in the US is largely publicly funded, yet still underperforms. The reason aligns with the broader thesis: the money pools at the wrong level. Because school funding flows primarily through local property taxes, wealthy neighborhoods buy excellent schools and poor neighborhoods receive chronically underfunded ones. The public investment exists; it simply pools at too small a geographic scale to equalize outcomes. Nationally pooled funding, as used by peer countries, produces more equal results for the same or lower total spend. Student debt compounds the problem at the university level: the average borrower leaves a four-year degree with $30,000 in debt. In Finland and Sweden, university is free. In Germany, annual administrative fees run approximately 400 euros.
The United States incarcerates 600 people per 100,000, more than the other seven peer countries combined.5 Finland incarcerates 50. Japan 40. Germany 70. A prison bed in the United States costs more per year than a year at most universities. The homicide rate is approximately 6 per 100,000, against Finland’s 1.5, Germany’s 1.0, Japan’s 0.2. The suicide rate of 14 per 100,000 is the second highest in the comparison group. Among the forty benchmarks assembled for this piece, the United States ranks in the bottom quartile of the peer group on incarceration, homicide, suicide, and gun violence. The United States is the wealthiest country in the comparison group by mean income. These are policy (not poverty) statistics.
The United States' income Gini coefficient of 41 is higher than that of every European peer. Mean wealth per American adult is $620,0006; median wealth is $124,000. The gap between the mean and the median, a five-to-one ratio, is the largest in the peer group and reflects the concentration of wealth in the top 1% and the centibillionaire class. Germany’s mean-to-median income ratio is closer to two-to-one; Finland’s is similar. A note on Sweden: it is an anomaly where income is distributed relatively equally, but wealth is highly concentrated, driven by dynastic industrial ownership. For wealth distribution, Germany and Finland are the cleaner comparisons. In countries where prosperity is genuinely shared, the mean and median income tell a similar story. In countries with extreme concentration, the mean tells the story of the rich, and the median tells the story of the regular folks.
The United States possesses the largest natural resource endowment of any country on earth: an estimated $45 trillion in mineral, timber, and energy wealth. It controls the world’s reserve currency and issues debt at the lowest borrowing rates available to any sovereign. It houses the world’s most valuable technology companies and the most productive agricultural sector. Norway funds its welfare state partly from oil revenues; Finland and Sweden fund theirs from tax revenues on economies comparable in structure to the United States. The claim that America cannot afford universal healthcare, subsidized childcare, or free university is a political position, dressed as a fiscal one.
Every American faces an expected lifetime care obligation of approximately $260,000: $170,000 in retirement healthcare costs not covered by Medicare (Fidelity 2025 Retiree Health Care Cost Estimate), and $90,000 in long-term care costs before Medicaid eligibility kicks in (Milliman LTC Index 2025).7 This is the care reserve, and it must be held in personal wealth before any other calculation is made. In peer countries, healthcare and eldercare are publicly funded; the equivalent care reserve is $20,000 in Sweden and Finland, $30,000 in Germany. The United States also carries national debt per capita of $114,000,7 and the picture clarifies when millionaires are removed from the analysis. The mean wealth of non-millionaire Americans is $150,000. The care reserve of $260,000 exceeds that entire figure, consuming every dollar they own before Medicaid steps in. The national debt of $114,000 then sits on top with nothing remaining to service it. The non-millionaire Swede holds mean wealth of $130,000, owes a care reserve of $20,000, and carries national debt of $20,000, leaving a real balance of $90,000. The care reserve is not a tax. It appears in no OECD comparison of fiscal burdens. But it is as mandatory as any levy, far more expensive than the collective equivalent, and heaviest on those least able to hold it.
Voter turnout in the United States in presidential elections has reached 65 percent, still below Sweden’s 80 percent, Germany’s 78 percent, and Finland’s 74 percent. In off-cycle American elections, turnout averages 29 percent. A government chosen by 29 percent of eligible voters is not a government with a strong democratic mandate to do anything difficult. Every peer country in this comparison uses a voting system that better translates vote shares into representation. The United States two-party duopoly is a structural feature, not a natural law, and it narrows the range of policy options that can survive a primary election. Structural inequality in political voice produces structural inequality in political outcomes.
Every program listed here exists, has been rigorously evaluated, and works. Finland’s Housing First model provided unconditional permanent housing to homeless people and reduced homelessness by 30 percent, at lower cost than the emergency shelter system it replaced. Germany’s dual apprenticeship system, which routes half its school leavers into rigorous employer-paid vocational training, produces the lowest youth unemployment rate in Europe without requiring a four-year degree as the price of entry to the middle class. Sweden’s non-transferable paternity leave quota increased paternal leave-taking, reduced the gender wage gap, and improved child development outcomes. Japan’s single-payer administrative structure cuts hospital billing costs from 34 percent of expenditure to 12 percent. The research on early childhood education (Finland and Sweden guarantee a subsidized place from age one) shows returns of four to seven dollars for every dollar invested. None of these programs require inventing something new. They require the political will to adopt what is already proven.
The comparative gap has deep roots, and its origins are well documented. The American welfare state was deliberately stunted by a series of political choices made across the twentieth century, many of them driven by the intersection of race, capital, and the unusual structural features of American federalism. The New Deal excluded domestic and agricultural workers, the two largest categories of Black employment. Medicare and Medicaid were passed only after a decade of bitter opposition. The Affordable Care Act left seventeen million Americans uninsured. Each peer country built its social compact in a different political context; most built it in the decades immediately after World War II, when the political logic of social solidarity was hard to argue against. The United States made different choices, and the choices compounded. The compounding is what the data shows.
Return, at the end, to the question the World Happiness Report asks: on a scale of zero to ten, how good is your life? The average Finnish respondent answers 7.74. The average American answers 6.73. The average American under thirty answers something closer to what a citizen of Malaysia or Thailand would say. The United States is richer than most of its peers on every aggregate measure, and all the peer countries are democracies with robust civil liberties. The explanation lies in return on investment. Finland, Sweden, and Germany invest sufficient collective resources in health, education, childcare, and security to produce outcomes that their citizens experience as a good life. The United States invests less collectively, forcing individuals to supplement the gap privately at greater cost and worse outcomes.
The author can be reached at iko@uw.edu
Sources
Opinion June 18th, 2026


Sunny, with a high of 75 and low of 60 degrees. Partly Cloudy for the morning, sunny in the afternoon, clear during the evening,